Introduction
I am purposefully avoiding the buzzword "big data" in the heading of this article, however I do not mean to understate the amount of data we are working with. A plethora of diverse datasets come in fast through our applications, and analyzing them as soon as we can is the key to revealing hidden patterns that enable the decision-making of our customers and stakeholders. These characteristics of data are often referred to as the four Vs of big data: Volume, Velocity, Variety and Veracity. Today we have very effective tools in our disposal to store, analyze and make sense of large datasets. In order to give you an idea of the problems we are solving by leveraging big data, allow me to briefly describe what we do at my company.
At WearHealth, we build solutions that augment the workforce: our platform reveals ergonomic risks and empowers stakeholders with objective insights for implementing the right solution. This is fueled by various streams of data originating from smartphones to wearable and IoT devices. In addition, we have distilled knowledge from expert ergonomists and HSE managers, which we have incorporated in the form of ontologies. These diverse datasets are then transformed into context-rich information that is either delivered, for example, as a safety notification to workers or an elaborate report for supervisors or managers. Do check our website if you wish to learn more.
In this article, I will share my experience and the lessons we learned along the way of extracting meaning from our data. I will not be specific about the third-party services or tooling we use and I will keep this cloud-agnostic and high-level.
A data pipeline makes up the core of our platform
What is a data pipeline?
The set of services and applications that move, process and transform our data from wearable devices on the customer's side to our analysis and business intelligence tools and applications, we refer to as "data pipeline". The term is oftentimes used interchangeably with "ETL/ELT" (i.e. "extract, transform, load") or "ETL/ELT pipeline", however the differences usually lie in the synchronicity of data ingestion and processing, and, with transformation being an optional step for a data pipeline system. Practically, it's better to think of ETL/ELTs as subsets of data pipelines.
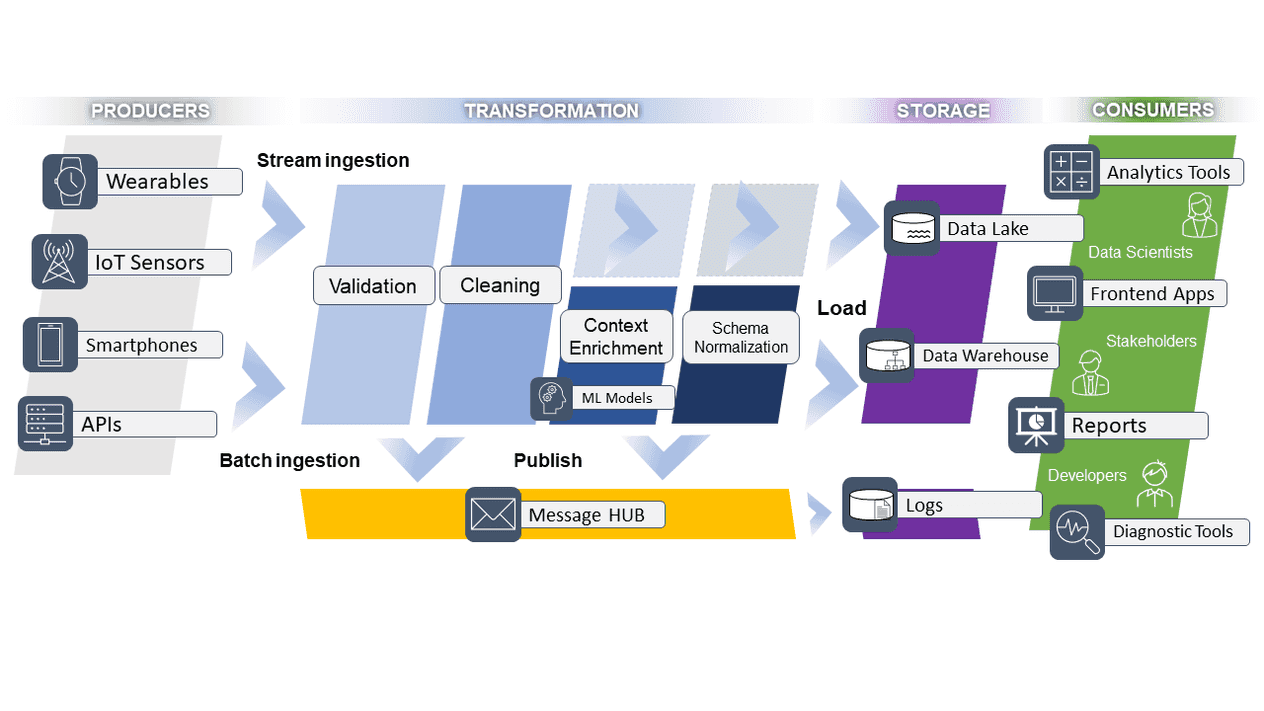
The diagram above is a high-level illustration of the steps our data pipeline consists of. At first, we ingest data both in real-time (stream ingestion) and at set intervals (in bulk and in batches) from wearables, IoT sensors, smartphones and APIs. The ingested data are then validated by verifying encoding, mime types, schema, and other parameters. Next, during the cleaning process, the system catches encoding errors, unexpected formats and removes ambiguous or duplicate records. That data is then stored in a data lake, which we are going to expand on in the subchapter below.
Further into the transformation flow, the validated and cleansed data continue their way into an analytics and context enrichment service; this is where our AI/ML models come into play. Afterwards, the data is normalized in schema and stored in a data warehouse. More on this later.
While these processes are taking place, logs containing metrics on data quality, data artefacts, overall processing time and more, are being generated and published to a message queue.
It's worth mentioning here that at the receiving end of the pipeline are a diverse group of consumers, each with their own needs and goals. Stakeholders have access to refined and context-rich data via frontend apps and reports; data scientists can use their tools and scripts on data from the data lake to run tests and further develop their algorithms and models; developers have access to logs for their diagnostic and performance tools. It's worth mentioning here that, for compliance and privacy purposes, not all information is available to everyone. For example, records are anonymized when accessed by our data science team.
What kind of data are we ingesting?
Given the producers we outlined earlier in this article, here's a short list of the data passing through our pipeline:
- CSV and Parquet files containing sensor data (such as accelerometer, gyroscope, ..., etc.);
- structured data from SQL databases;
- JSON data via our REST APIs
Early on, CSV (or any delimited record format you may use) was the go-to format when viewing the data on an Excel sheet or importing them in our Python scripts. This process became tedious and as the size of files kept increasing we switched to Parquet (from Apache). Apart from taking up less space, the column-oriented nature of Parquet speeds up querying: we don't have to read the entire table, instead we read a single column independently. Furthermore this format is supported "out of the box" by many services, tools and frameworks from Amazon Athena to Google BigQuery, Hadoop, Spark, and more.
What is a data lake?
Stored data in a data lake undergo few or sometimes no transformations, thus resemble very closely their structure and contents from source. In addition, data lakes often host a variety of data types, structures and contents. In such an environment, most queries will run suboptimal. Initially we saved everything in a file, without any underlying database engine or model. This was the leanest approach in storing and sharing with our data science team.
What is a data warehouse?
Imagine a warehouse of a company that distributes electronics. Employees and/or automated machines in that warehouse are capable of navigating the spaces, fetching items, classifying and organizing new wares in a very efficient manner. Questions such as "how many spare parts do we have for X?" or "when can we order the next batch of Y to meet demand?" are easily answered. That makes up for a very happy logistics department. In a similar mindset, a data warehouse is a database where data is modeled and stored in a way that's most effective in answering questions that are important to our business.
Lessons we learned thus far
How we started
When we first started, we were collecting smaller datasets - compared to the ones we collect nowadays - and we didn't always know what kind of answers we can get from our data. Therefore, we started simple, by ingesting large flat files containing information that we didn't necessarily know we needed. At least, we had the flexibility to experiment and decide later. We had set up an ETL system which we would feed with data at fixed intervals, in a micro-batching fashion, which then was running queries and analytics, and generating metrics on daily schedule. In hindsight, that was the right decision as our business was growing, because we had very few moving pieces and we could iterate faster on something that was evolving rapidly.
Lesson 1: compensate for the unpredictability in ingested data early on
It's a data engineer's ideal scenario to only have to work with flawless and consistent datasets, so that they don't have to bother as much with the actual contents. In reality, data need to be validated and cleaned through the first steps of the pipeline. This is because we cannot fully trust the owners of the systems belonging to the groups of producers.
Once corrupt data find their way into our data warehouse, it's not always the case that they create error logs or impact the system in a detrimental way. This makes dealing with that data later on especially hard as they become more and more embedded and intertwined with the rest.
Lesson 2: plan batch-processing during customer-friendly times
For particular use cases, the source system of the ingested data could be a relational database with business critical data for backend applications, which, in turn, enable features in other client applications running on browsers or on mobile devices. Because of this, processes responsible for fetching that data must not overburden the resources, network bandwidth or API rate limits from those systems.
Lesson 3: enable yourself and your team to track performance, investigate and troubleshoot effectively
Logs are very important! We collect core vitals and outcomes from every step in the data pipeline:
- validation outcomes;
- overall cleanliness score and quality;
- model predictions and parameters. This should enable your AB testing as well;
- application warnings and errors;
- trace identifiers, version numbers, ..., etc.
Lesson 4: plan ahead the sequence of task execution and flow of data
In the beginning stages of our product, we would implement and orchestrate the necessary transformation steps gradually without a clear plan. As a result, sometimes our data would cycle back to upstream services and this caused all sorts of problems that were hard to debug. With this in mind, we defined a graph for the flow of data and the dependencies of tasks:
- the execution of a task that depends on another doesn't start unless its dependency is finished;
- a task shouldn't invoke a previously completed task. Borrowing from a concept in graph theory, the DAG (Directed Acyclic Graph) design pattern dictates that tasks shouldn't cycle back.
Lesson 5: data contracts (as a service)
To exchange data reliably between services, we defined a central schema registry which is used for E2E testing and data validation. Essentially, it's a tiny API that collects all contracts (data structures) and partakes in validation, documentation and integration (E2E) testing. This way we are able to track schema changes and plan backward and forward compatibility carefully between our services.
Lesson 6: transparency, observability and reporting for everyone
We made sure everyone outside the engineering team could get an idea of the traffic of data through the pipeline and a summary of the key metrics each day. For this, we setup listeners to certain events which would then publish to the public chat and threads of our digital workspace platform.
As anecdotal evidence, a teammate once noticed certain discrepancies in the metrics and helped us detect a problem with our analytics algorithms which we later corrected. Help can come from where you least expect it sometimes!
Of course, critical errors would also land in our chat and through our log database with records for each step of the pipeline with clear execution identifiers, we were able to troubleshoot easily.
Lesson 7: get the timestamps right
Last but not least, when setting up such a system, getting the timestamps right across the steps and services will save you from major headaches! For example, sticking to UTC in a standard format (e.g. ISO 8601) with localization happening closer to the consumer-end of the pipeline make sense. At the very least, if you happen to consume or join datasets containing both UTC and local simultaneously, this needs to be properly indicated from the data properties.
Closing thoughts
Internally, we perceive our data pipeline as the "highway of data" where "traffic" is regulated, "parking spots" or "stops" are well indicated and provide facilities and commodities for every business need. The perspectives of the internal or external stakeholders we serve are diverse and this needs to be reflected on the data on the consumer-end of the pipeline.
Our first steps were messy with many unknowns, however we remained pragmatic in our approach. As soon as we started uncovering the meaning behind our data, while, at the same time, understanding the needs of our consumers, we had a list of clear requirements for the system at hand.
I hope that the experiences and lessons outlined in this article help you in your data engineering endeavors.

